
CTA funnel reporting
CTA funnel reporting shows how often your calls to action were seen, clicked, and converted into interest. Use it to compare live and replay performance and improve your broadcast offers.
Where to find it
Go to Insights.
Open Broadcast Engagement.
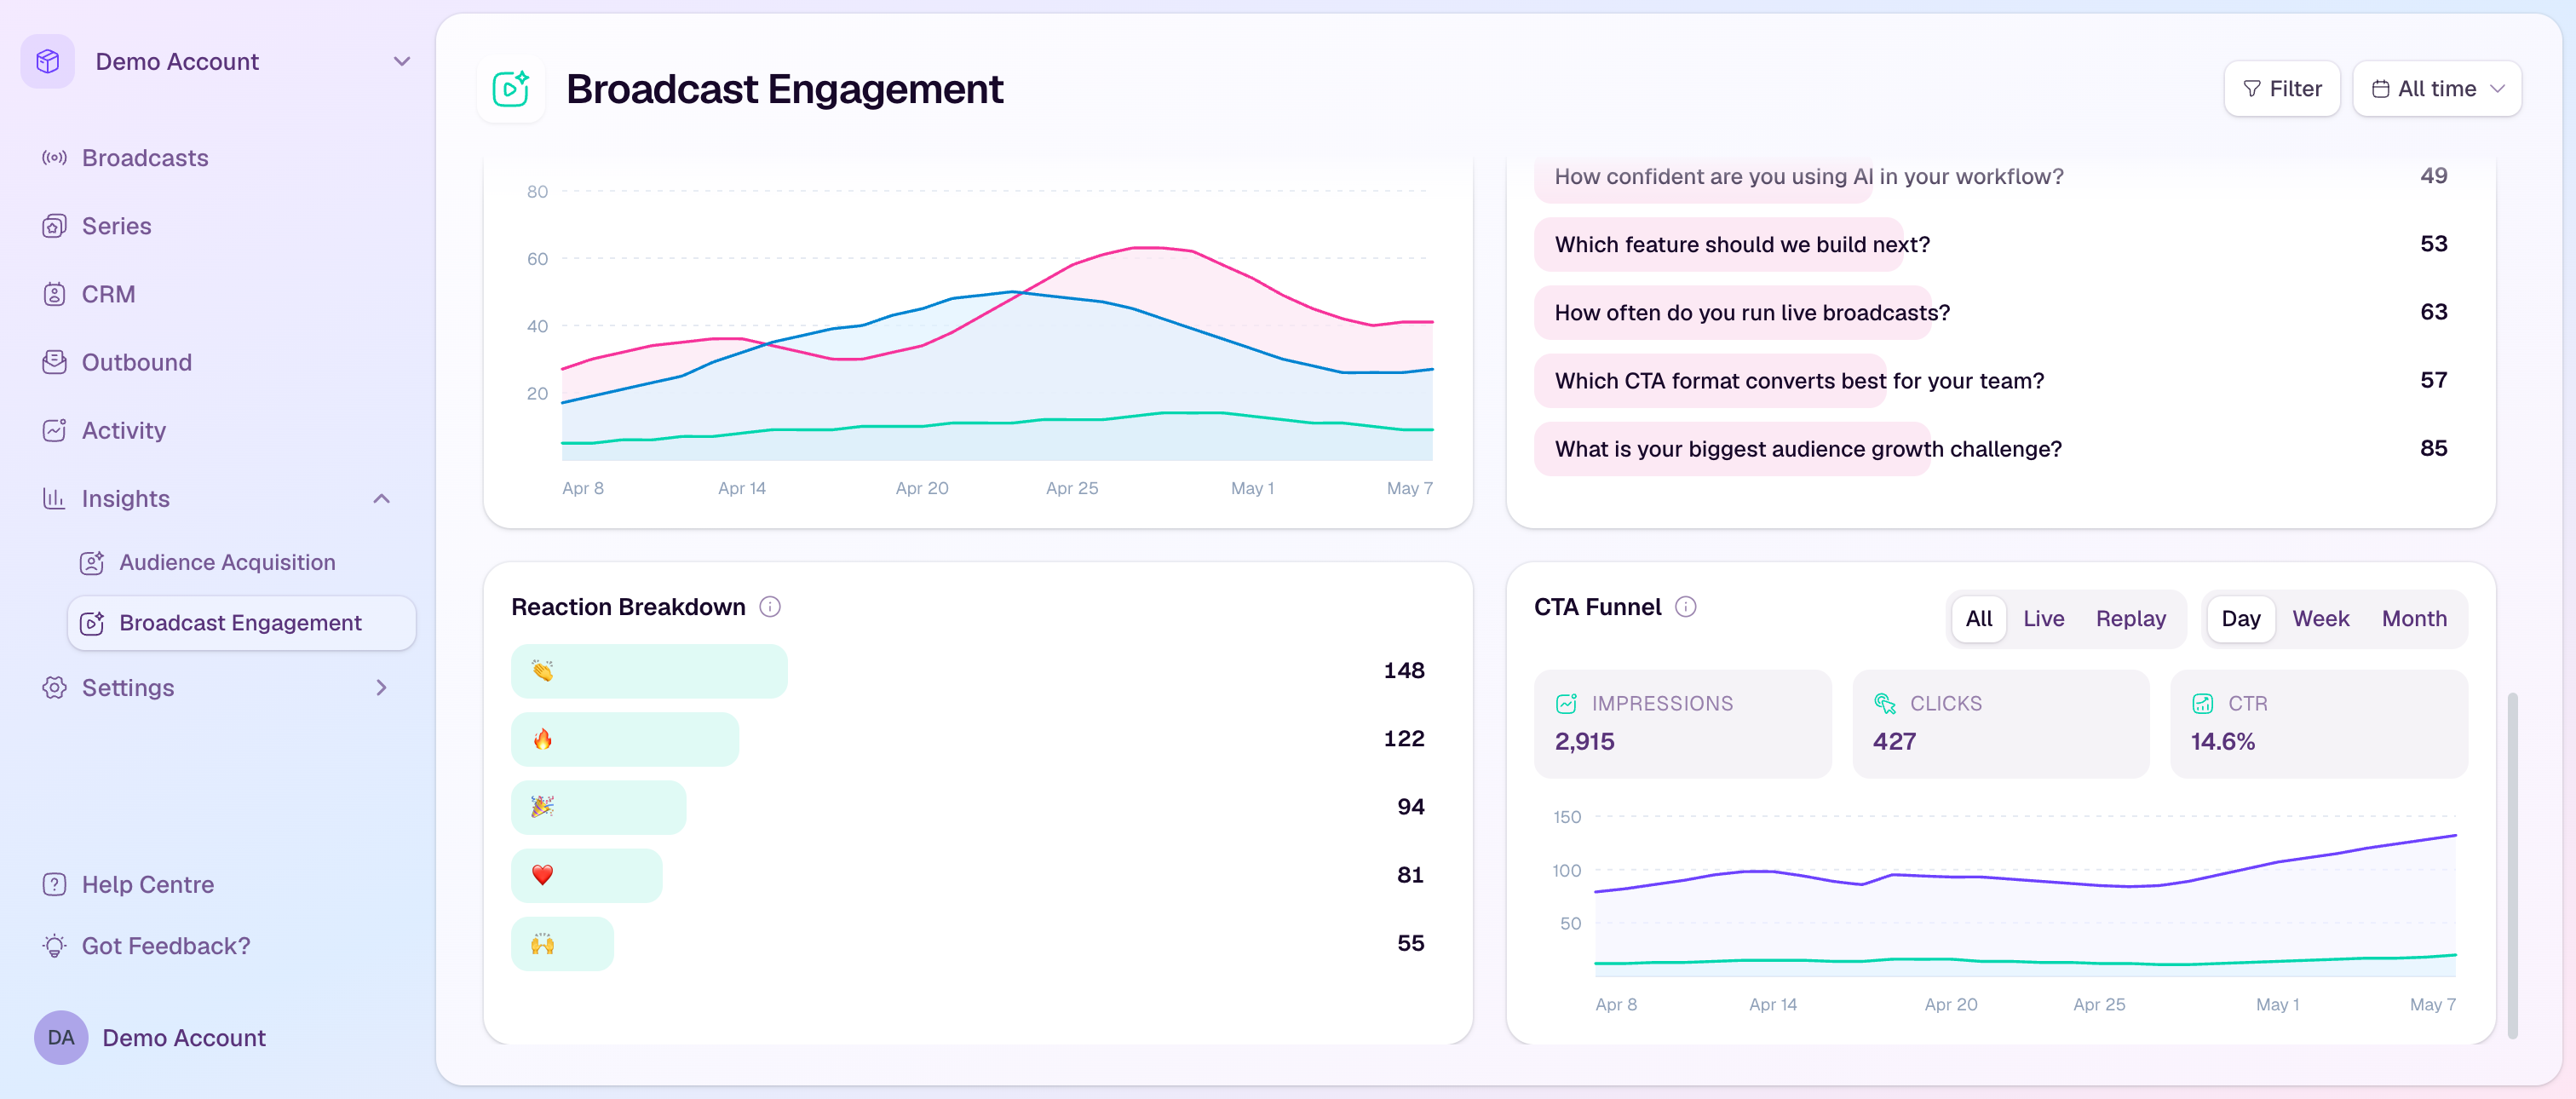
Scroll to CTA Funnel.
If the card asks you to select a broadcast, use the Filter button and choose the broadcast you want to review.
What the metrics mean
Impressions counts unique contacts who were shown a CTA in the selected scope.
Clicks counts unique contacts who clicked a CTA.
CTR is the click-through rate from impressions to clicks.
The chart shows impressions and clicks over time so you can see when CTA engagement happened.
Compare live and replay
Use All for combined CTA performance.
Use Live to see how CTAs performed while the broadcast was live.
Use Replay to see whether the offer continued to attract clicks after the event.
Use Day, Week, and Month to change the chart granularity.
Improve CTA performance
If impressions are high but clicks are low, test a clearer label or stronger offer.
If replay clicks are strong, keep replay access and follow-up emails active for longer.
Compare CTA timing with engagement patterns to decide when to show offers in future broadcasts.
Use payment CTA reporting alongside CTA funnel data when the CTA is tied to a purchase flow.