
Broadcast engagement insights
Broadcast Engagement shows how people watched and interacted with your broadcasts across live and replay. It is the best place to understand viewing depth, attendance quality, and interactive participation.
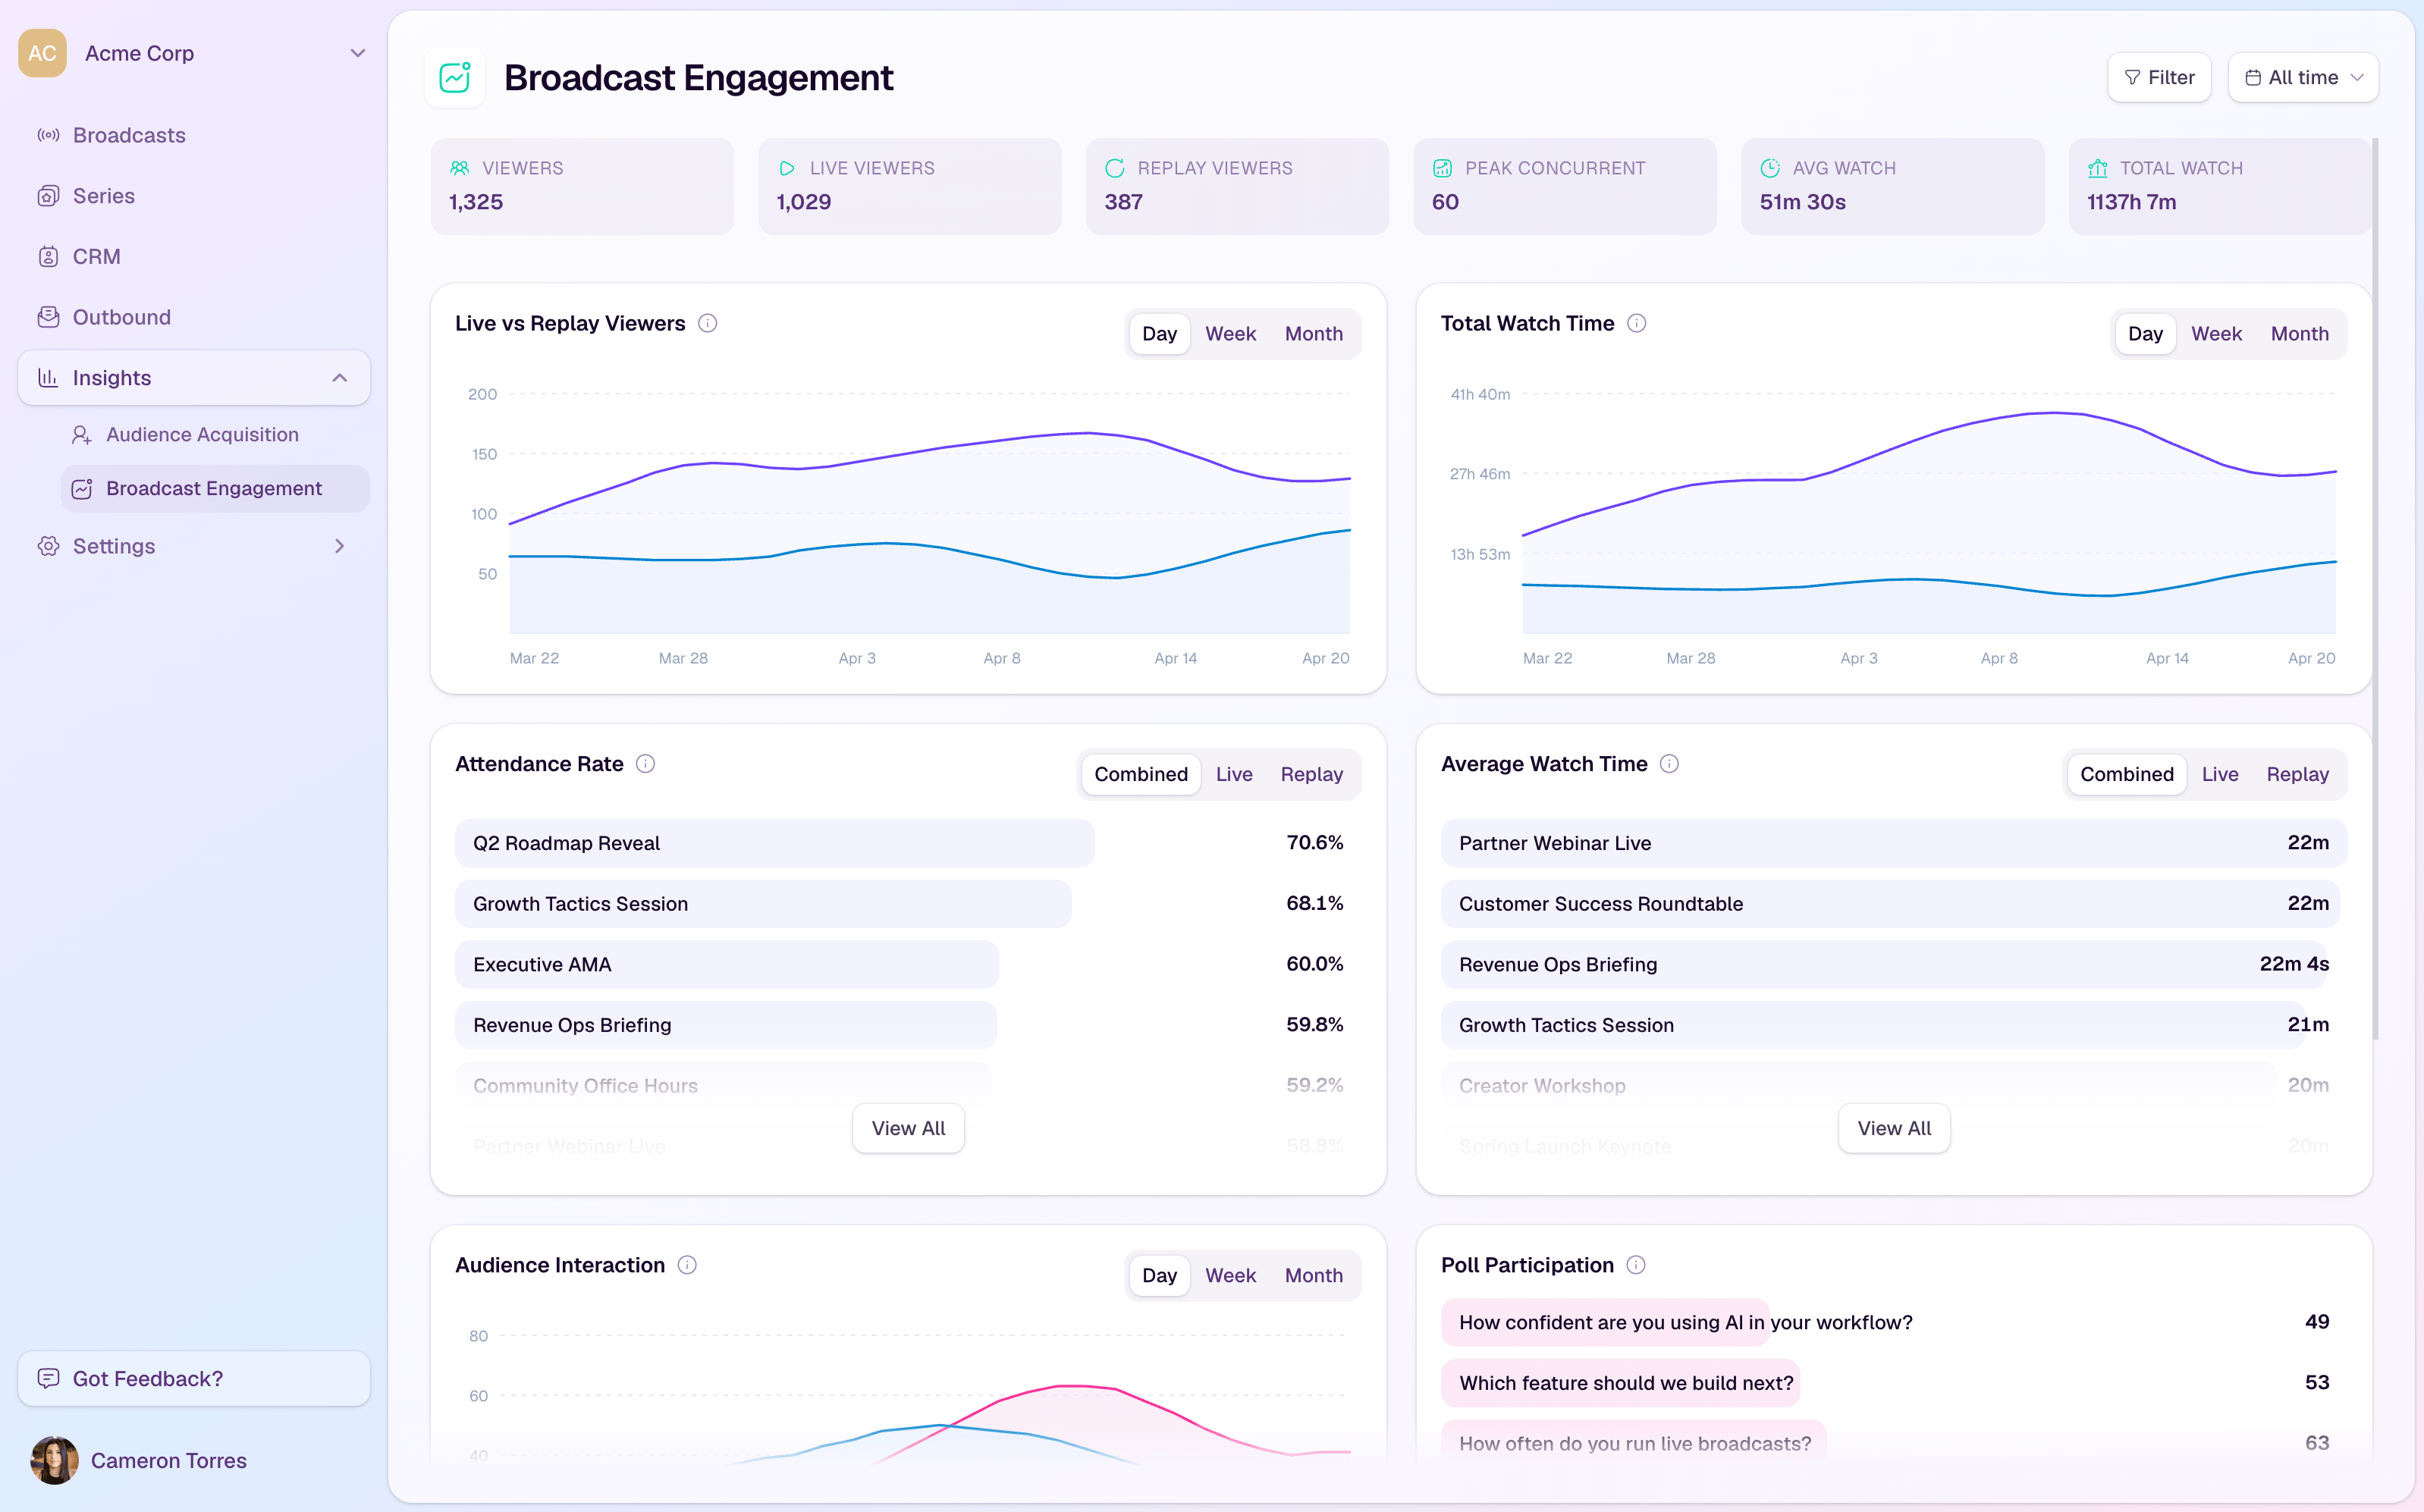
Headline metrics
Viewers shows total unique viewers in the selected range.
Live viewers and Replay viewers separate live attendance from replay consumption.
Peak concurrent shows the highest simultaneous live audience size.
Avg watch and Total watch summarize viewing depth.
Core charts
Live vs Replay Viewers shows viewing split over time.
Total Watch Time shows how much time viewers spent watching live and replay content.
Attendance Rate ranks broadcasts by the share of registrants who watched.
Average Watch Time ranks broadcasts by viewing depth.
Audience Interaction combines chat messages, questions, and poll responses over time.
Interaction sections
Poll Participation shows which polls attracted the most responses and the response rate.
Reaction Breakdown shows the most-used live reactions.
CTA Funnel shows impressions, clicks, and click-through rate when CTA reporting is available for the selected scope.
Filter the dashboard
Filter by broadcast when you want to review one event in detail.
Filter by series when you want a campaign-level view across related broadcasts.
Use the date range selector to compare recent engagement with longer-term performance.