
Audience acquisition insights
Audience Acquisition shows how people discover your registration pages, how many register, and which registration questions they answer. Use it to understand where your audience came from and which channels are converting.
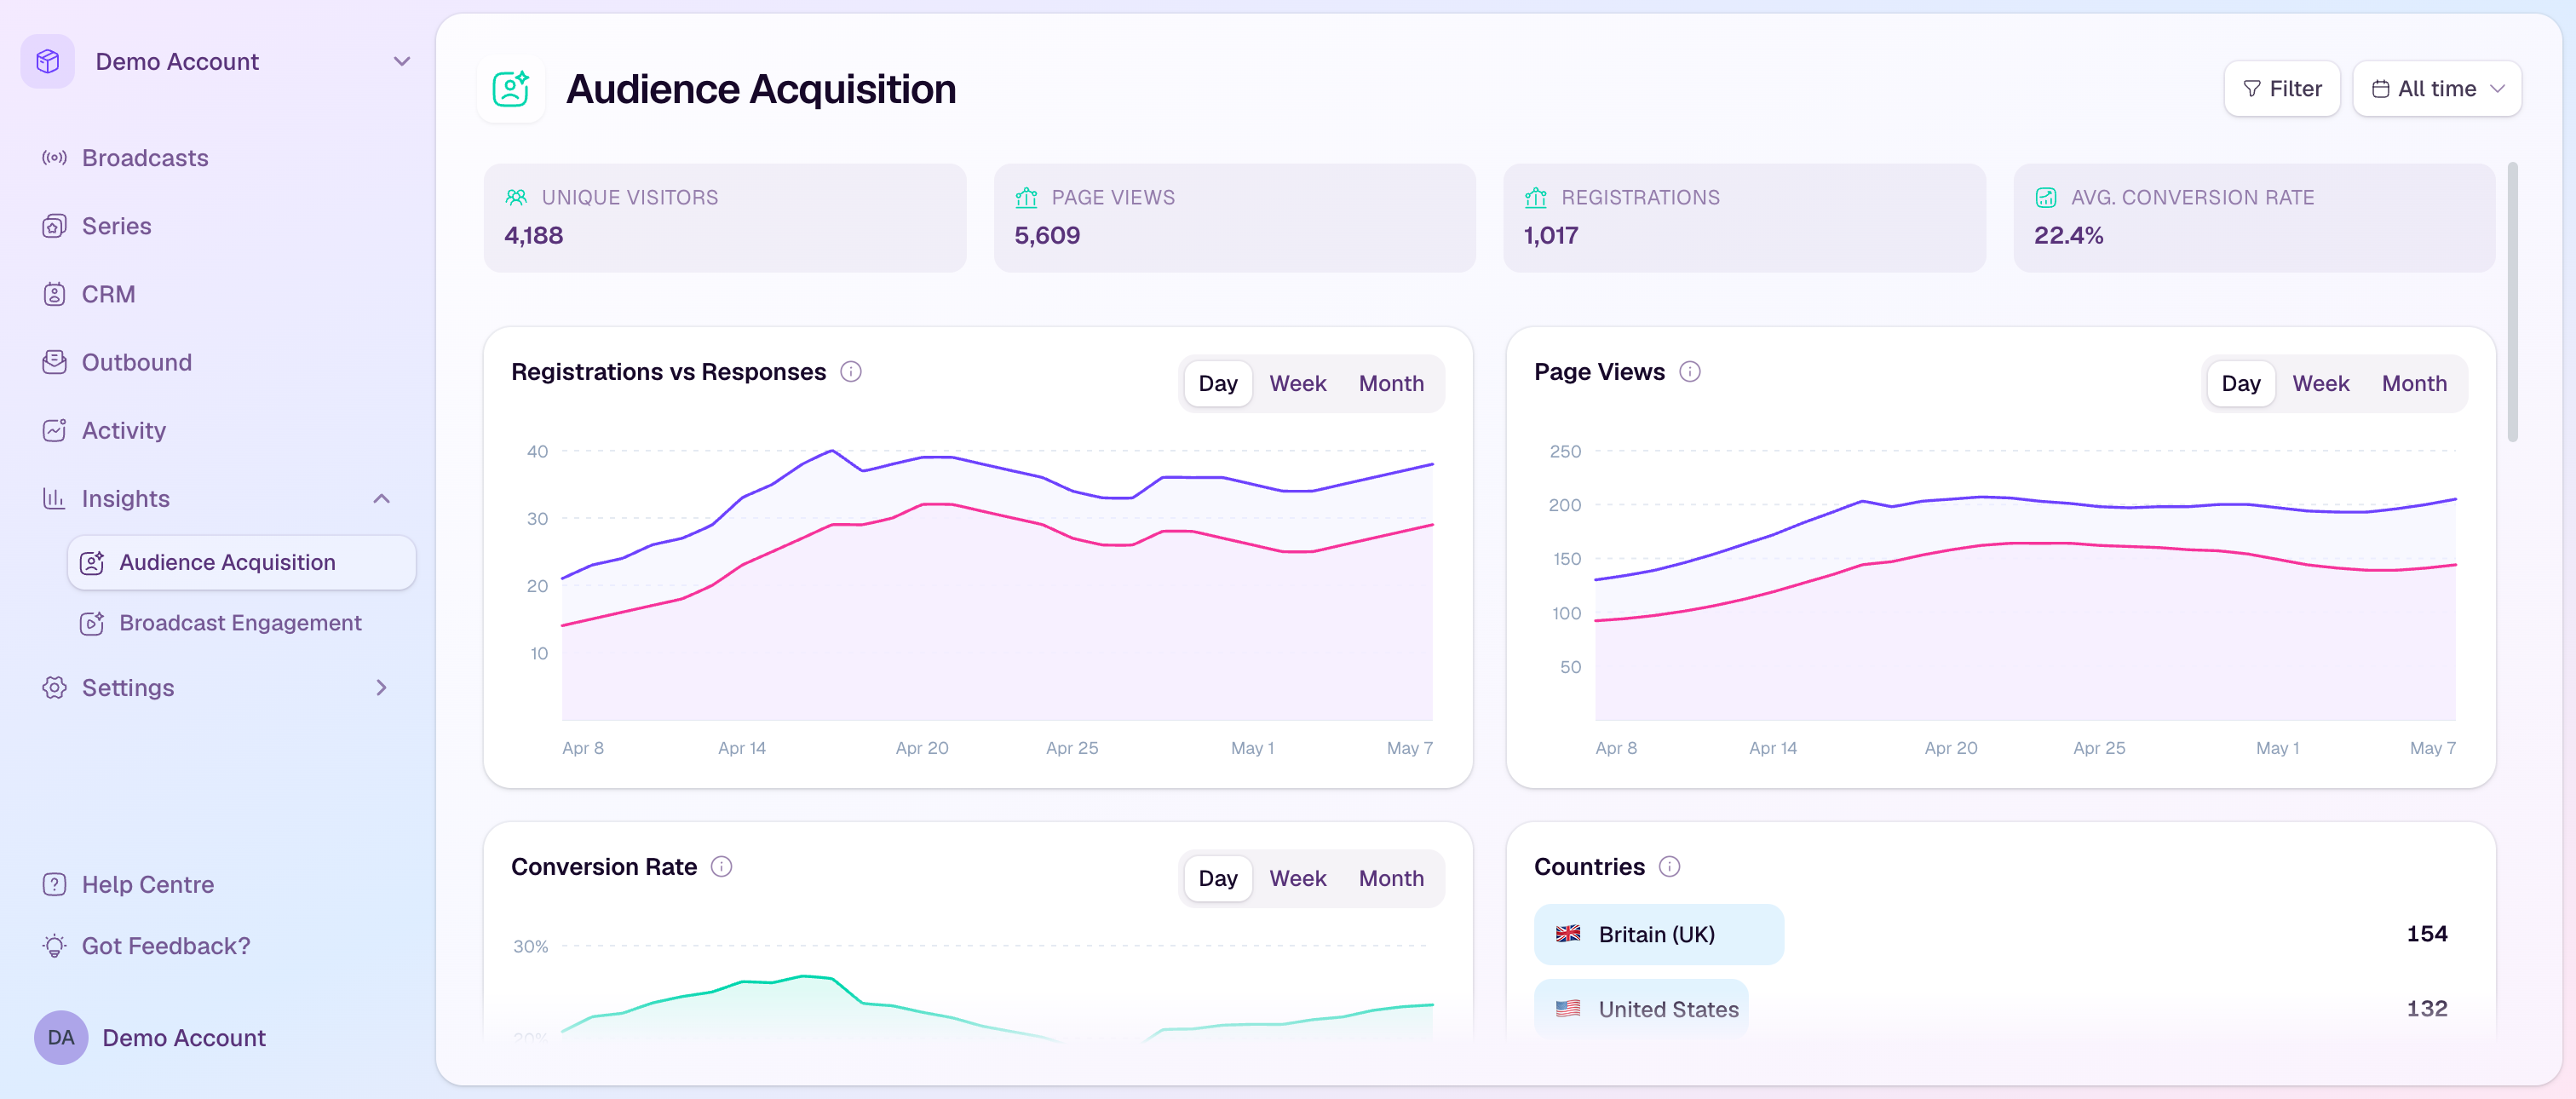
What the overview shows
Unique Visitors: the number of distinct people who visited registration pages in the selected range.
Page Views: total registration page views.
Registrations: completed registrations in the selected scope.
Avg. Conversion Rate: the average rate from registration page visitor to registrant when conversion data is available.
Use the charts
Registrations vs Responses compares registration volume with completed registration-question responses.
Page Views shows registration page traffic over time.
Conversion Rate shows how traffic converted into registrations.
Countries, Attribution, and Referrers show where registrants came from and which tracked sources contributed.
Filter the dashboard
Filter by broadcast or series to focus the dashboard on one event or campaign.
Filter by registration status to compare all registrants with attendees where that scope is available.
Filter by country when you need to understand regional acquisition patterns.
Use the date range selector to compare recent activity with all-time performance.
How to use the data
Invest more in channels that bring qualified registrations, not just page views.
Look for registration pages with high traffic but weak conversion and review the offer or page copy.
Use country and attribution data to tailor follow-up campaigns and future broadcast promotion.